Bitcoin’s Wild Ride: Where Could It Be Heading Next?
Bitcoin, the first and most famous cryptocurrency, has been on a rollercoaster ride lately. After reaching an amazing high of nearly $109,300, Bitcoin took a big dip, losing over 21% of its value and dropping to around $87,534 by late February 2025[3]. This sudden change has sparked a lot of talk among experts about where Bitcoin might go next. Let’s explore the current market situation and look at two important charts that might show us what’s in store for Bitcoin.
Understanding the Current Market Situation
Bitcoin’s Price Drop
Bitcoin’s recent price drop has been caused by several things. Some people think that worries about the global economy and problems between countries might be to blame[3]. Also, there have been a lot of people taking their money out of Bitcoin ETFs, which might have added to the drop in price[3].
Technical Analysis: The Wyckoff Model
Some people who study the technical aspects of the market think that the Wyckoff reaccumulation model might show us what Bitcoin will do next. This model suggests that Bitcoin might be getting ready for another big increase, like the one we saw in August 2024 that made the price go up by 40%[3]. But this model also shows that Bitcoin is currently in a “Test” phase, where it’s trying to stay above its support level around $85,950[3].
Chart Analysis: Where Bitcoin Might Be Headed
Chart 1: Support Levels and Resistance
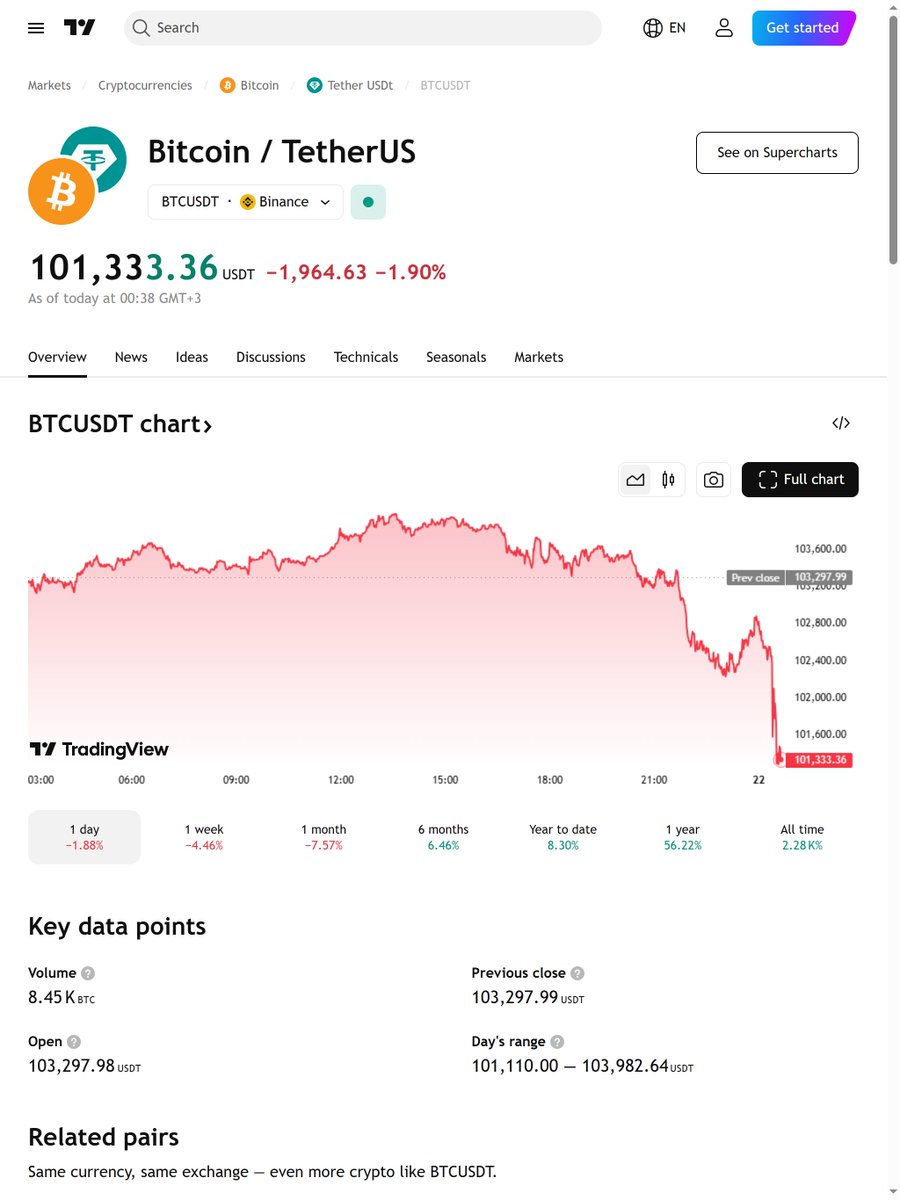
The first chart shows us the important support and resistance levels for Bitcoin. Right now, Bitcoin is having a hard time staying above the $86,813.41 support level[5]. If it can’t stay above this level, Bitcoin might drop even further, maybe even down to the $81,502.03 support level[5]. But if people start buying more Bitcoin, it might try to break through the $88,972.37 resistance level, which could mean a possible recovery[5].
Chart 2: MACD and RSI Indicators
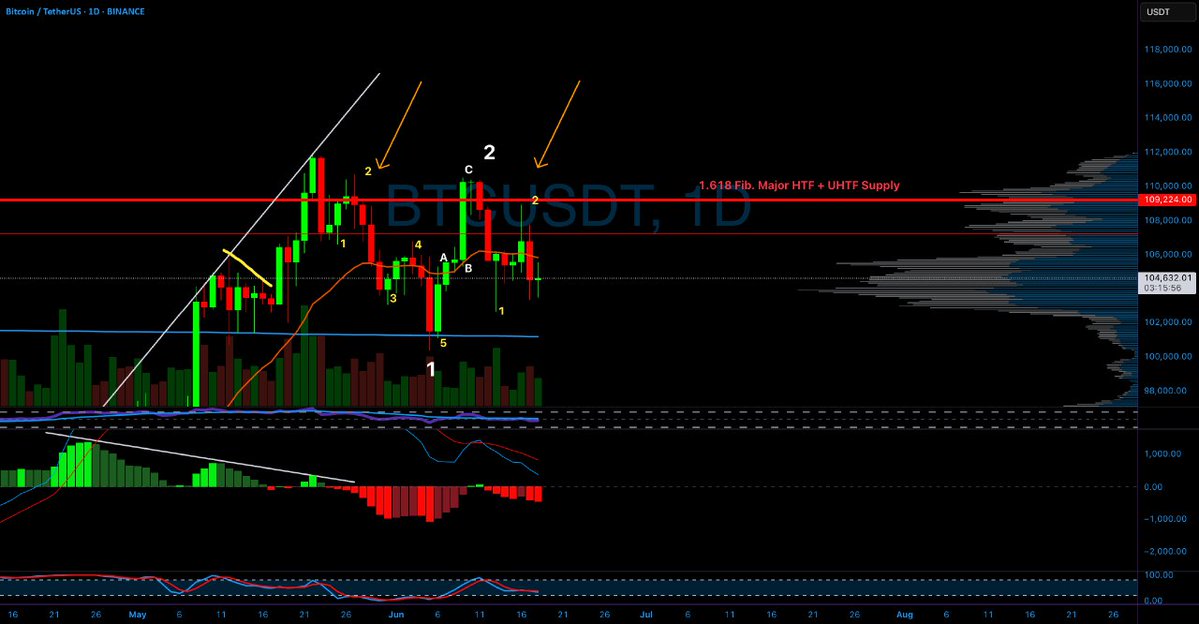
The second chart shows us two important technical tools called the Moving Average Convergence Divergence (MACD) and the Relative Strength Index (RSI). These tools have helped us predict Bitcoin’s short-term movements in the past. Recently, we’ve seen a mix of “death crosses” and “golden crosses” on the MACD line, which means that there are both downward and upward pressures on Bitcoin’s price[5]. The RSI has also shown that Bitcoin has been oversold at times, which sometimes leads to a brief recovery[5].
Conclusion: Facing the Unknown
As Bitcoin goes through this tough time, investors and experts are watching closely to see if it will recover or drop even further. The charts show us that Bitcoin’s immediate future will depend on whether it can stay above its key support levels and how it reacts to broader economic factors. We don’t know yet if Bitcoin will go back up to the $100,000 mark or if it will have a deeper correction. But one thing is for sure: the road ahead will be full of ups and downs and chances for both gains and losses.
Sources: