Decoding the Ethereum Bull Flag: A Deep Dive into Market Patterns and Price Predictions
Charting the Course: Why Patterns Matter in Crypto Trading
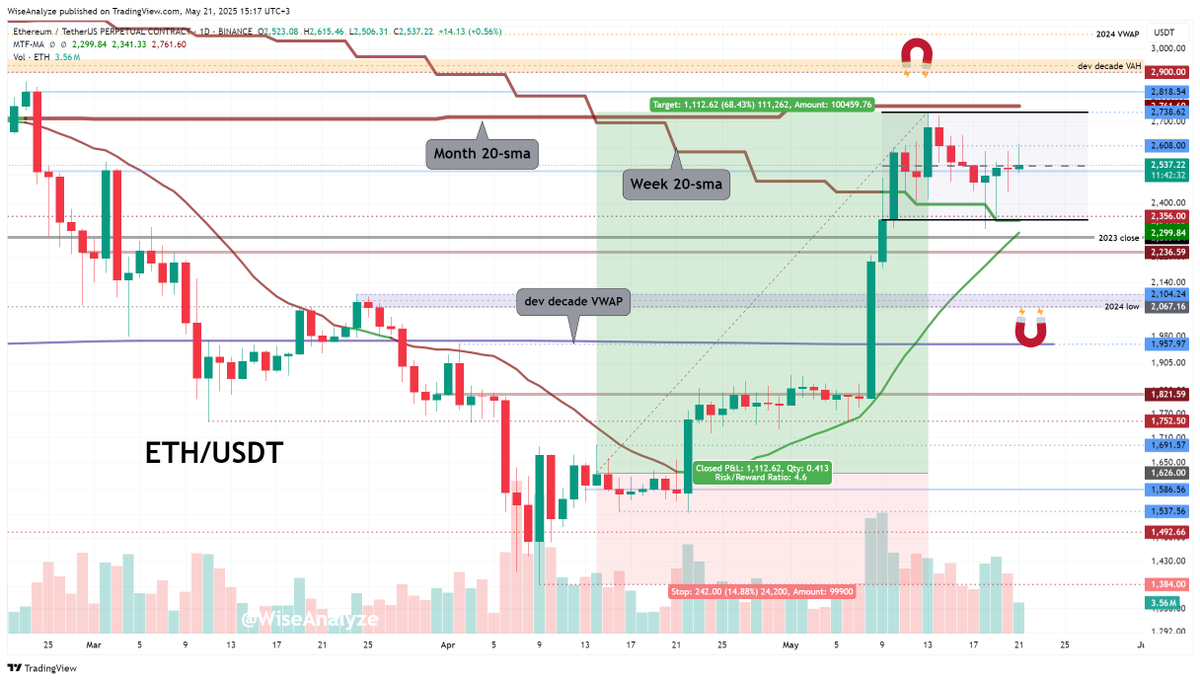
Stepping into the world of cryptocurrency trading is like navigating a vast ocean with many storms. The waves are prices, the winds are market sentiments, and the instruments at hand are technical analyses. Among these, chart patterns act as the compass for many traders, helping them anticipate where the currents might take a particular asset. Ethereum, being the second-largest cryptocurrency by market capitalization, often steals the spotlight. Recently, a “bull flag” pattern has been identified for Ethereum, resting between the price points of roughly 2356 and 2738. This pattern and its relationship with key moving averages create a rich tapestry for understanding potential future moves.
But before diving into the specifics, it’s crucial to understand what exactly a bull flag is and why it captures the attention of market analysts so frequently.
The Bull Flag: More Than Just a Shape on a Chart
At its core, a bull flag is a technical pattern that hints at the continuation of an existing upward trend. Picture a sturdy flagpole representing a strong price increase. Following this surge is a period where the price consolidates, drifting slightly downward or sideways—this is the flag itself. Essentially, the market catches its breath before potentially scaling greater heights.
For Ethereum, this “flag” is framed between 2356 (support) and 2738 (resistance). The support level acts like a safety net, a floor where buying interest has historically stepped up to prevent prices from falling further. Conversely, the resistance level serves as a ceiling that the price has struggled to pierce. Together, this channel bounds the price action, hinting that the market is waiting for a catalyst to break free either upward or downward.
The importance of this formation lies in the balanced tension within the channel—it’s a negotiation between buyers and sellers, a thin line drawn between fear and optimism. When such patterns occur alongside key technical indicators like moving averages, the insights grow even more nuanced.
Moving Averages: The Market’s Weighted Memory
Simple Moving Averages (SMAs) are among the foundational tools in technical analysis. By smoothing out price fluctuations over a specified period—like a few weeks or months—they reveal the trend’s general direction. Think of SMAs as the market’s memory: they help traders focus on the bigger picture amid daily chaos.
In this Ethereum scenario, two SMAs take center stage:
– The Monthly SMA, which filters the noise over a longer horizon, indicating how Ethereum is faring in the broad, ongoing narrative. Staying above this average often signals that a bullish trend remains intact.
– The Weekly SMA, zooming in on intermediate-term sentiment, provides insights into the near-term momentum.
Intriguingly, the bull flag’s boundaries roughly align with these moving averages. This overlap is not mere coincidence—it suggests that these price levels are recognized as significant by market participants. Traders often place their bets around these averages, making breakouts or breakdowns more meaningful when they coincide with these technical pillars.
Ethereum at the Crossroads: Momentum Ready to Pick a Direction
Currently, Ethereum finds itself near the middle of the bull flag channel. This situation can be likened to sitting at a fork in the road, where the path ahead might lead either to continuing gains or a corrective downturn.
On one hand, pushing above the upper boundary near 2738 could ignite bullish momentum, pushing prices to revisit prior highs or even forge new ones. On the other hand, slipping below the floor at 2356 might signal deeper retracement, aligning with analyst forecasts that suggest a fallback towards 2100.
This finely poised condition embodies the dynamic tug-of-war between optimism and caution, reminding us that market behavior often hinges on collective psychology as much as fundamentals.
The Significance of the 2100 Level: A Possible Temporary Retreat
Mentioning a potential retreat back to 2100 might sound bearish at first glance, but in market dynamics, such pullbacks are often healthy. They allow the asset to “shake out” weaker hands and create a firmer foundation for a renewed rise.
The 2100 level is not plucked from thin air—it corresponds with historic price support zones and likely aligns with longer-term moving averages, perhaps the 200-day SMA, which many traders respect as a major trend barometer. Hitting this level could represent a strategic pause in Ethereum’s bullish journey rather than an outright reversal.
This observation serves as a reminder that market trends don’t advance in straight lines. Corrections and retests provide opportunities for recalibration, avoiding the pitfalls of irrational exuberance.
Strategic Considerations for Traders and Investors
Understanding a bull flag and its context equips market participants with a tactical edge. Here are several practical takeaways stemming from this Ethereum analysis:
Concluding Thoughts: The Bull Flag as a Story of Market Balance and Anticipation
Ethereum’s stance within the bull flag channel captures a snapshot of a market in delicate balance, poised at the edge of decisive movement. The intertwining of this pattern with key moving averages underscores that this isn’t just an idle technical curiosity—it’s a dynamic arena where trader sentiment, historical price behavior, and algorithmic signals converge.
For those who track such formations, this moment is a call to attentiveness, blending patience with readiness. Whether Ethereum breaks free upwards to renew bullish advances or dips to re-establish support around 2100, market participants are witnessing an unfolding narrative of tension, decision, and possibility.
In many ways, the bull flag isn’t just about price action; it’s a window into how humans collectively react to uncertainty, hope, and strategy. Observing these patterns offers a richer appreciation of the market’s complexity and the dance of psychology beneath the charts.
—
Related Reading
– Investopedia: Bull Flag Pattern
– CoinDesk: How Moving Averages Can Guide Crypto Investors
– Ethereum Price Analysis & Predictions – CryptoNews